 Data Science Central:
With ever increasing volume of data, it is impossible to tell stories without visualizations. Data visualization is an art of how to turn numbers into useful knowledge.
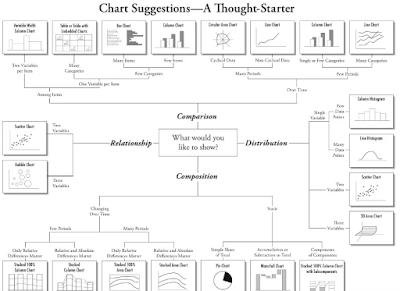
R Programming lets you learn this art by offering a set of inbuilt functions and libraries to build visualizations and present data. Before the technical implementations of the visualization, let’s see first how to select the right chart type.
Read more...
